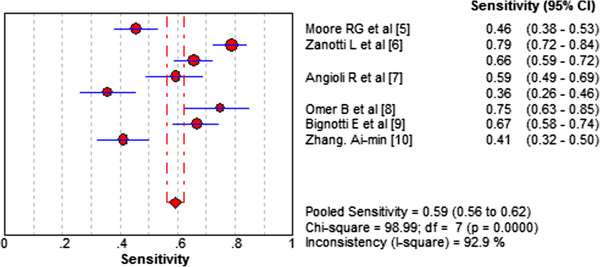
Figure 2.

Forest plots of sensitivity of HE4 for EC prediction. The red circles represent the sensitivity of one study; the black line shows its confidence interval. If a study reported accuracy data for more than one cut-off, its results are included more than once.
