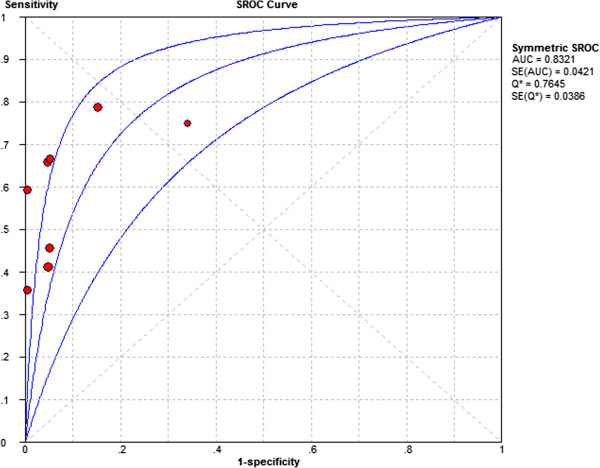
Figure 5.

SROC of HE4 for EC prediction. Each circle represents each study in the meta-analyses. The size of each study is indicated by the size of the circle. The regression summary receiver operating characteristic curves summarize the overall diagnostic accuracy.
