Figure 1.

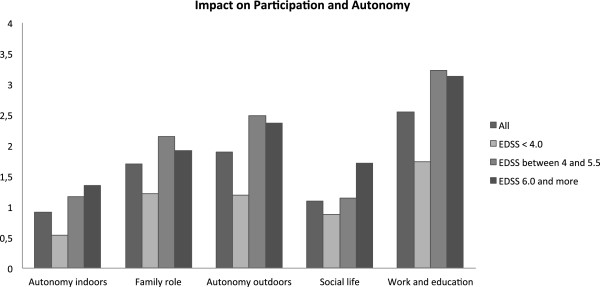
Mean scores for each IPA domain, in the entire population and 3 groups separated by EDSS. Scores for each domain range from 0 to 4; lower scores indicate better social participation.

Mean scores for each IPA domain, in the entire population and 3 groups separated by EDSS. Scores for each domain range from 0 to 4; lower scores indicate better social participation.