
Figure 1.
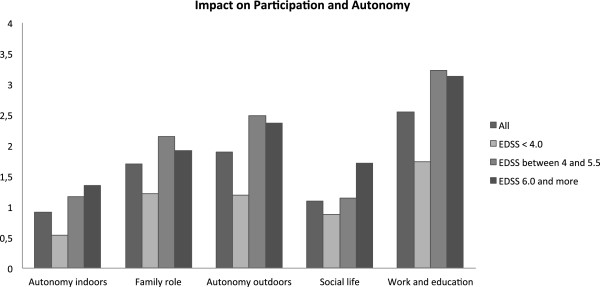
Mean scores for each IPA domain, in the entire population and 3 groups separated by EDSS. Scores for each domain range from 0 to 4; lower scores indicate better social participation.
Official websites use .gov
A
.gov website belongs to an official
government organization in the United States.
Secure .gov websites use HTTPS
A lock (
) or https:// means you've safely
connected to the .gov website. Share sensitive
information only on official, secure websites.
Mean scores for each IPA domain, in the entire population and 3 groups separated by EDSS. Scores for each domain range from 0 to 4; lower scores indicate better social participation.