
Figure 5.
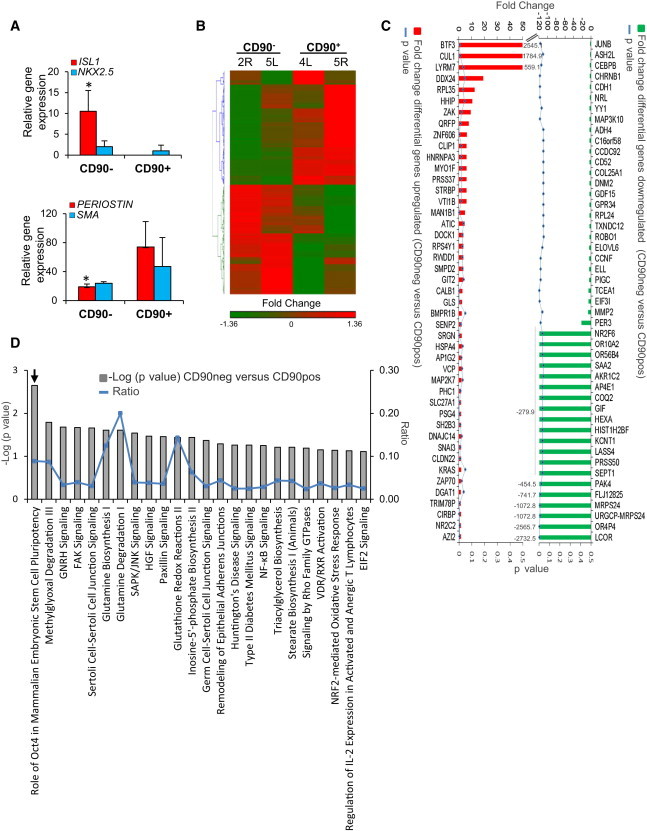
Transcriptome Profile of CS-Derived Clones
(A) Quantitative real-time PCR analysis for ISL-1, NKX2.5, Periostin, and SMA in CD90− and CD90+ CS-derived clones.
(B) Hierarchical clustering analysis of the four CS-derived clones. Differential gene expression was determined using the mean for each sample of CD90− clones versus CD90+ clones. Hierarchical clustering analysis was performed using Partek Genomic Suite software.
(C) Differential expression of genes upregulated (red) and downregulated (green). Blue line represents p value of <0.05.
(D) Pathway analysis using ingenuity pathway analysis (IPA). Significant enrichment of canonical pathways in CD90− samples versus CD90+ samples (gray bars) is shown. Blue line represents ratio.
n = 6; ∗p < 0.05.