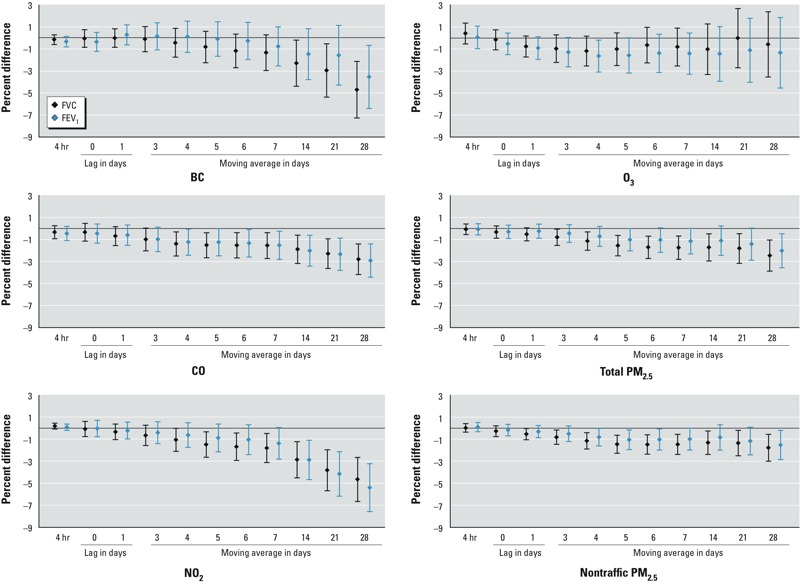
Figure 1.

Percent difference in FVC and FEV1 (and 95% CIs) associated with 1 IQR increase in air pollutant concentration, the Normative Aging Study, 1999–2009. Depending on the pollutant, the number of observations ranged from 1,259 to 1,275. Results were adjusted for age, race, height, weight, education level, smoking status, cumulative smoking, season of the medical examination, day of the week, visit number, temperature, relative humidity, asthma, chronic bronchitis, emphysema, methacholine responsiveness, corticosteroids, sympathomimetic α and β, anticholinergics. The IQR (μg/m3) was 0.6 for BC, 362 for CO, 15 for NO2, 33 for O3, 7 for total PM2.5,and 5 for nontraffic PM2.5.
