
Figure 3.
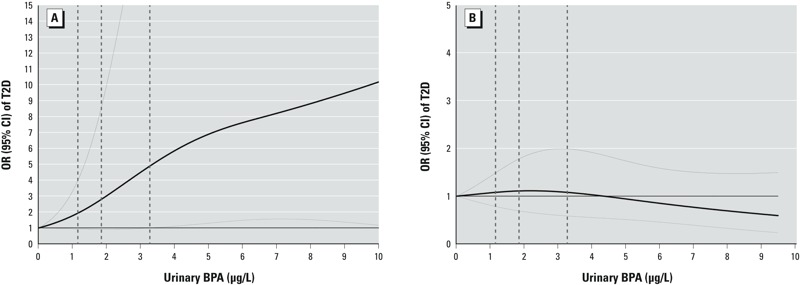
ORs (95% CIs) of incident T2D by urinary concentrations of BPA. (A) Among premenopausal diabetes cases and their matched controls; (B) among postmenopausal diabetes cases and their matched controls. Study participants with the highest 5% of BPA levels were excluded to minimize potential impact of outliers. We adjusted the multivariate conditional logistic regression models with restricted cubic splines for matching factors, including age at urine sample collection, ethnicity, fasting status, and time of sample collection, menopausal status and use of hormone replacement therapy (NHSII only), urinary creatinine levels, BMI, smoking status, postmenopausal hormone use (NHS only), oral contraceptive use (NHSII only), physical activity, alcohol use, family history of diabetes, history of hypercholesterolemia or hypertension, and AHEI score. Solid lines are ORs and dashed lines are 95% CIs. The dotted vertical lines represent the cut points for the quartiles listed in Table 2.