
Figure 2.
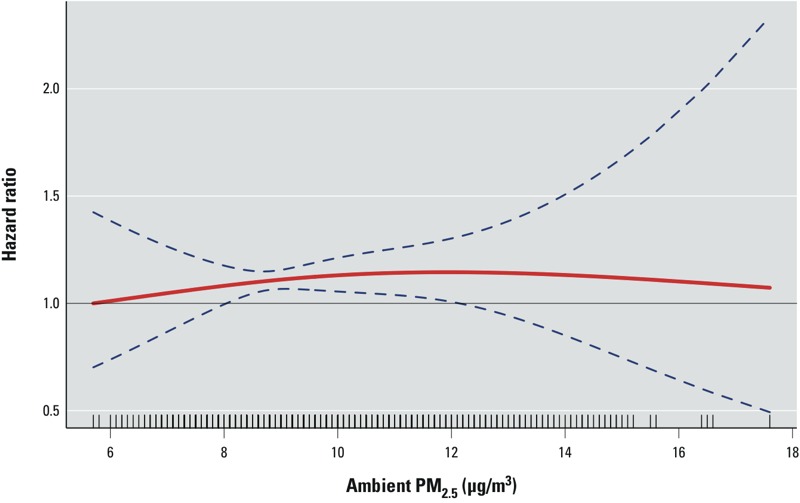
PM2.5 concentration–response curve (solid red line) and 95% CI (blue dashed lines) for cardiovascular mortality in men based on natural spline models with 2 degrees of freedom. The Cox model was stratified by state of enrollment and birth year category and adjusted for BMI (kg/m2), pack-years of smoking, marital status, education, alcohol consumption, and vegetable consumption.