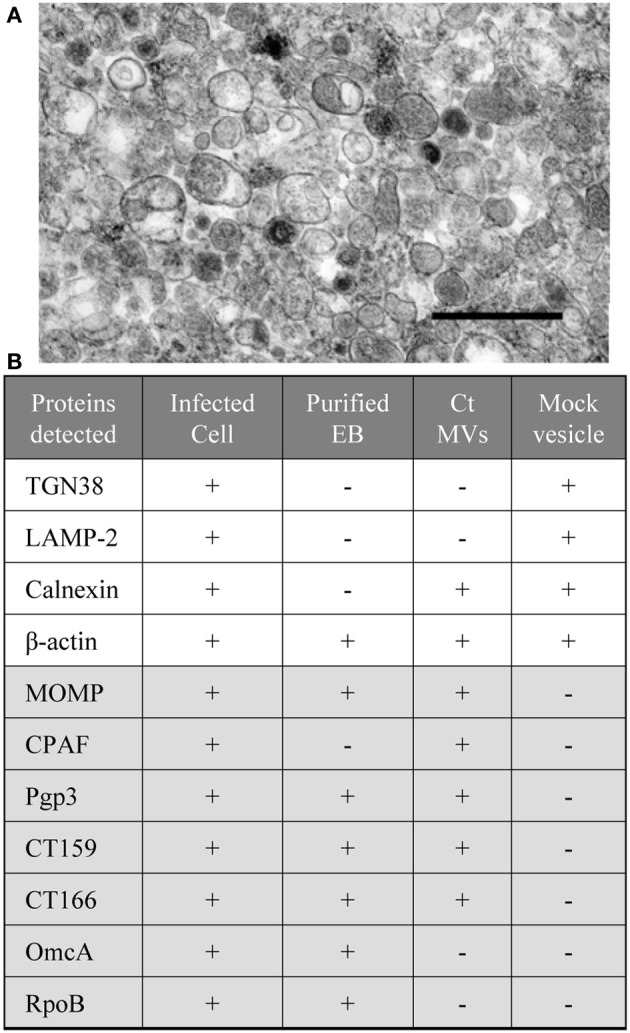
Figure 4.

Compositional analysis of C. trachomatis MV fractions. (A) Micrographs of isolated MV fractions from C. trachomatis infected L929 cells by method described previously (Frohlich et al., 2012). At the ultrastructural level, the MVs show heterogeneity in their size and morphology. Scale bar = 500 nm; (B) C. trachomatis (Ct) or host cell proteins detected by immunoblotting with the lysates of infected cells, EBs, chlamydial MVs, and the control vesicles from mock infected cells. Note: coexistence of host ER marker (calnexin) with selective chamydial proteins (MOMP, CPAF, CT159, and CT160). Proteins were separated by 12% SDS-PAGE, followed by immunoblotting with antibodies to the protein of interest as described previously (Frohlich et al., 2012).
