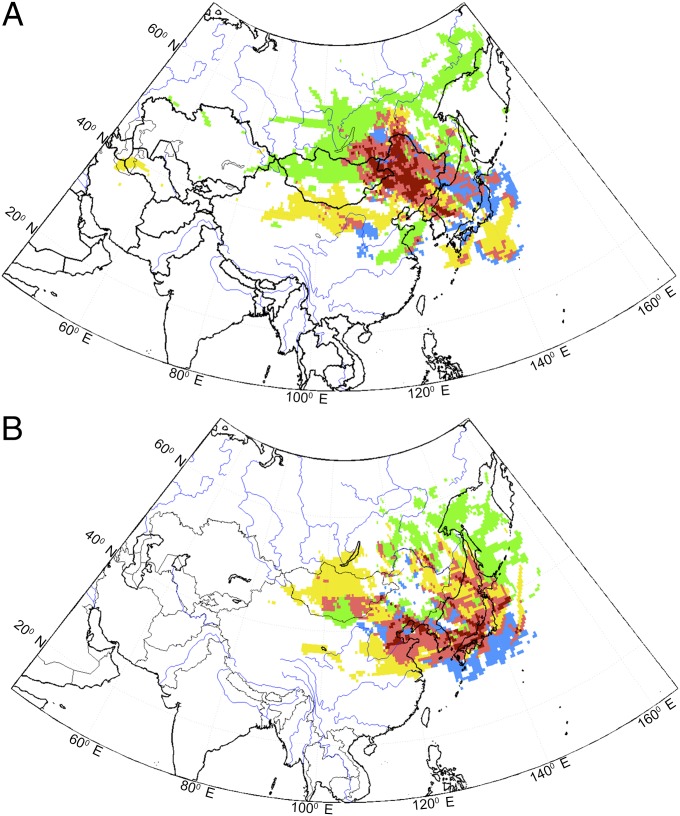
Fig. 3.
Areas of (A) high–low or (B) low–high differences in the residence time between sets of cases with high KD and low KD occurrences in the postepidemic interval. Residence time differences higher than 30 s are shown for Tokyo (blue), Sapporo (green), and Nagoya (yellow). The ensembles included have been generated averaging residence time data corresponding to lags of 1–3 d, which appears to capture all of the potential range of values for the KD incubation time. The total number of dates used in the simulations was 1,344. Red areas indicate overlapping high-residence time differences from two cities (light) or three cities (dark) residence time anomaly areas.

