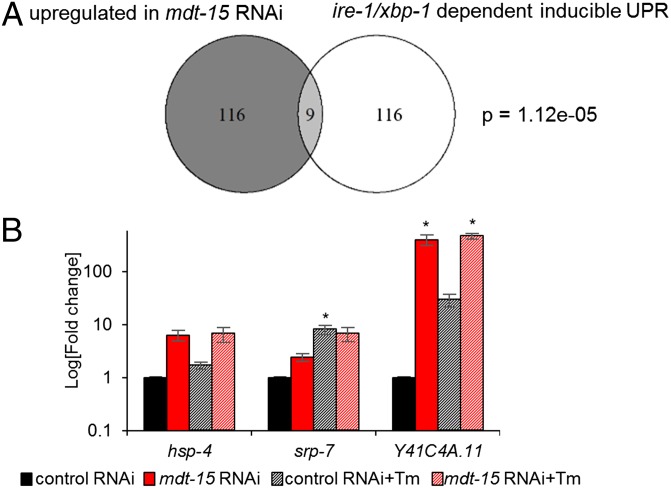
Fig. 3.
mdt-15 is not directly involved in the UPRER. (A) The Venn diagram shows the overlap between genes up-regulated in mdt-15(RNAi) worms and the ire-1/xbp-1–dependent inducible UPR genes. The P value was calculated using Fisher’s exact test, as described (7). (B) Bar graphs represent the average fold change of mRNA levels in control(RNAi) and mdt-15(RNAi) worms treated with DMSO or 10 μg/mL tunicamycin; fold change is relative to DMSO-treated control(RNAi) worms. For hsp-4: P = 0.069, 0.12, and 0.11, respectively; for srp-7: P = 0.069, 0.05, and 0.10, respectively; and for Y41C4A.11: P = 0.056, 0.072, and 0.012, respectively. n = 3; error bars represent SEM; *P < 0.05 as determined by two-tailed Student t test.

