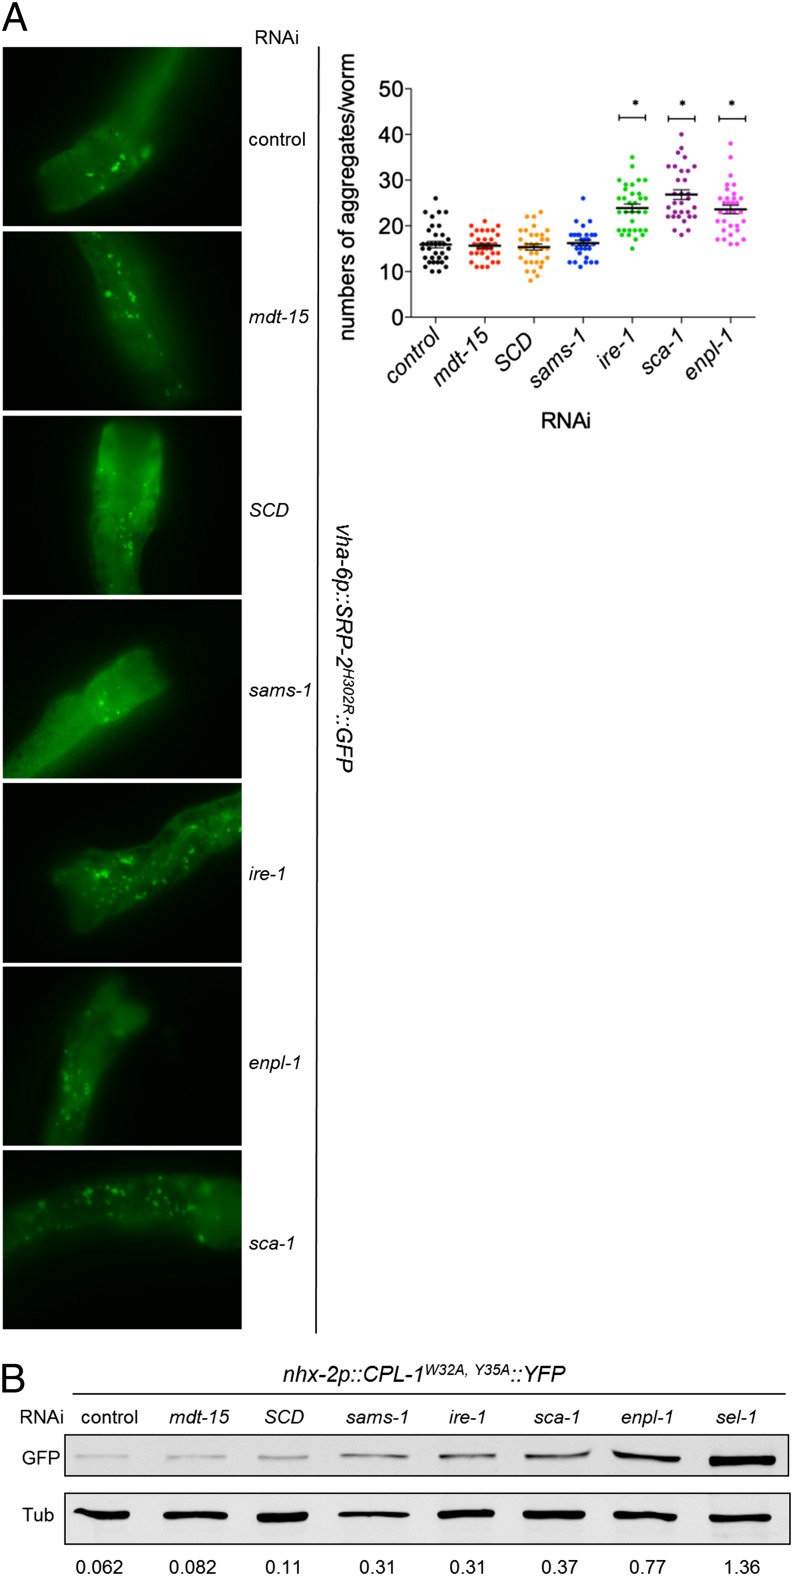
Fig. 5.
mdt-15 inactivation and defects in PL biosynthesis do not enhance misfolded-protein aggregation. (A, Left) Micrographs depict SRP-2H302R::GFP foci in control, mdt-15–, SCD-, sams-1–, ire-1–, enpl-1–, and sca-1–depleted worms. (Right) The dot plot represents the quantification of GFP aggregates; data points were pooled from three independent experiments. *P < 0.0001 compared with control RNAi. The nonsignificant P values are mdt-15, 0.89; SCD, 0.80; and sams-1, 0.48. (B) The immunoblot shows the levels of CPL-1W32A,Y35A::YFP and tubulin (loading control) in lysates from control, mdt-15–, SCD-, sams-1–, ire-1–, sca-1–, enpl-1–, and sel-1–depleted worms. The numbers below the blots represent the intensity of the bands relative to corresponding tubulin bands. One of four independent experiments is shown.

