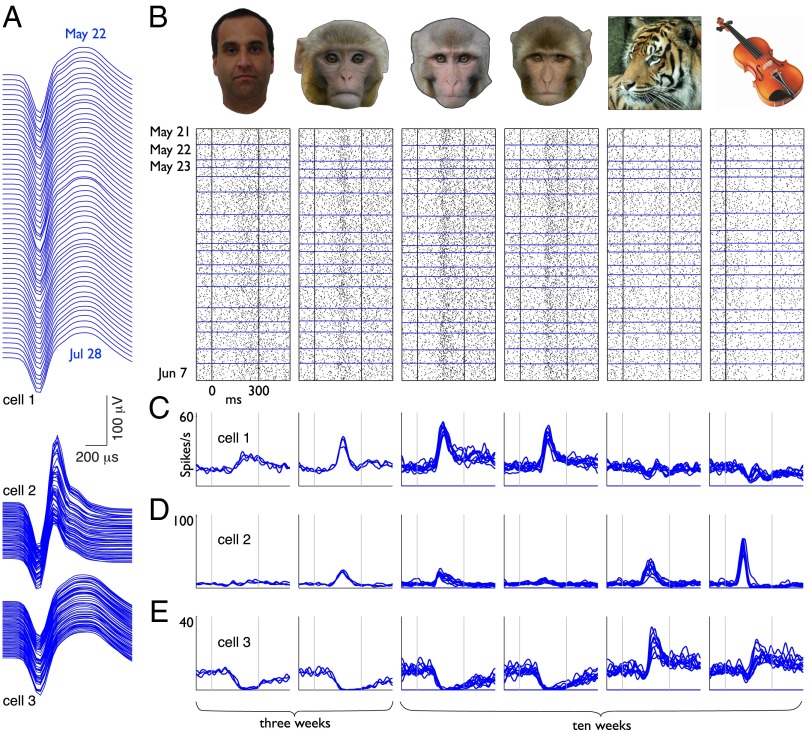
Fig. 2.
Consistent visual responses from three face-selective neurons tracked in daily recording sessions over two months. (A) Spike waveforms of three neurons observed in a series of daily recording sessions over the course of 68 days. Principal components clusters are shown in Fig. S2. (B) Stimuli and corresponding visual responses from one neuron (cell 1, also shown in A and C) drawn from a series of daily recording sessions. Each raster plot consists of 436 trials collected over the first 18 consecutive days of recording. (C–E) Weekly averaged visual responses from the same neurons shown in A over three weeks (469 trials, left two stimuli) and 10 weeks (1,200 trials, right four stimuli).

