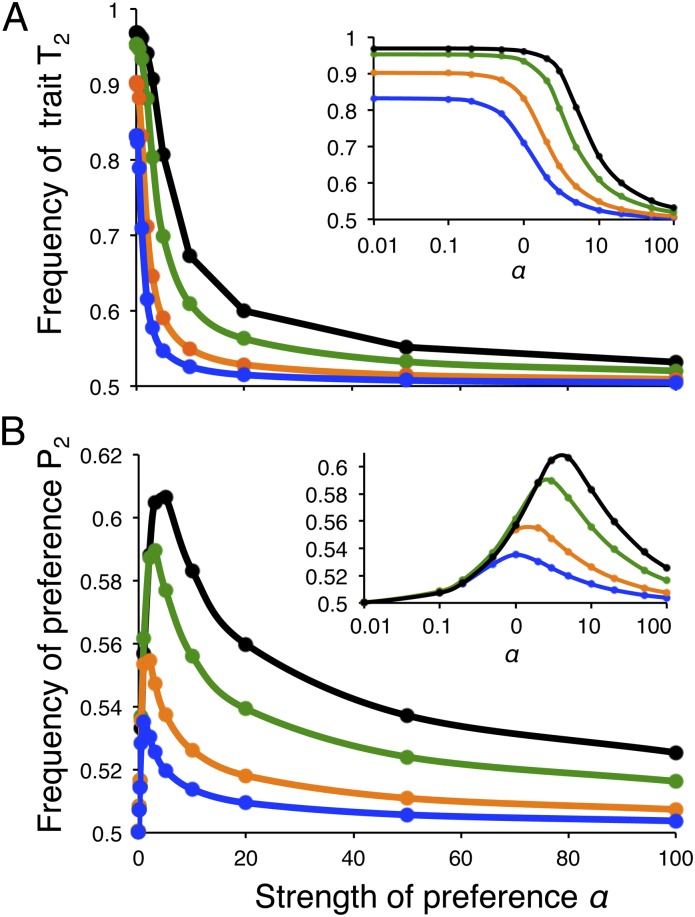
Fig. 1.
Male trait and female preference frequencies show a decrease in their differentiation between populations when sexual selection is strong. Shown are the frequencies in population 2 of (A) the trait T2 and (B) the preference P2 for a given strength of preference α1 = α2 = α from numerical simulations (SI Text). Insets show the same data with α on a Log scale. The frequencies of the T1 and P1 alleles in population 1 are seen to converge to the values shown here for population 2. Higher values thus represent more differentiation between the populations in trait and preference frequencies, whereas there is no differentiation at 0.5. In general, minor deviations from symmetry in parameter values did not alter our qualitative results, and the equilibrium values are independent of the starting conditions, although convergence may be very slow (SI Text). With strong asymmetry in s or α Fisherian sexual selection also does not allow for divergence, but the frequencies in both populations may converge to the same side of 0.5 (SI Text). Circles indicate simulation results and the lines connecting them are interpolations. Values of α are 0.01, 0.1, 0.2, 0.5, 1, 2, 3, 5, 10, 20, 50, and 100. The migration rate m = 0.01 and the selection coefficients for local adaptation are s = 0.9 (black), s = 0.5 (green), s = 0.2 (orange), and s = 0.1 (blue).

