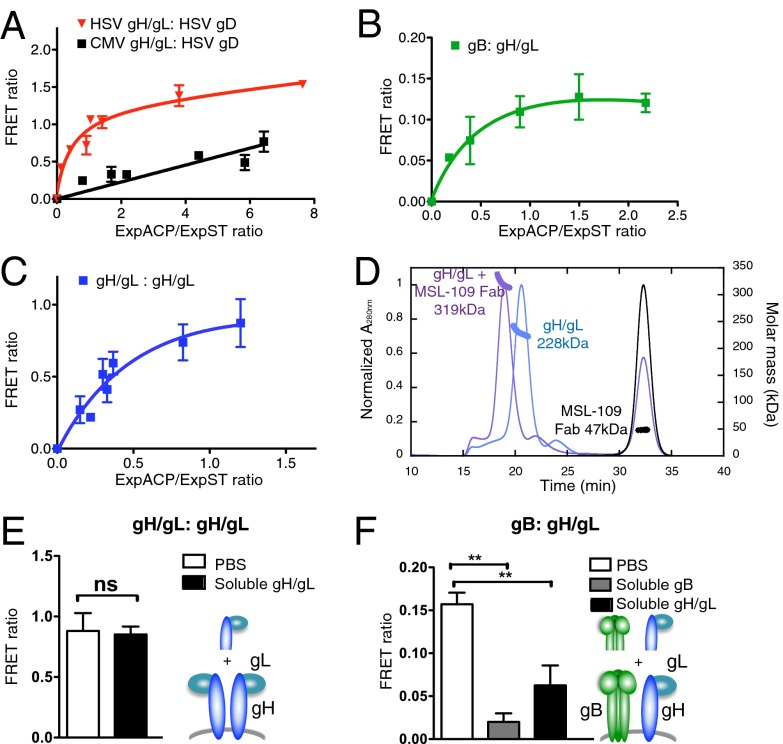
Fig. 5.
Glycoprotein interactions as monitored by TR-FRET. (A) TR-FRET saturation curve of HSV-1 ST-gH/gL with HSV-1 ACP-gD, or CMV ST-gH/gL with HSV-1 ACP-gD. Cells were cotransfected with a constant amount of HSV-1 ST-gH/gL or CMV ST-gH/gL and increasing amounts of HSV-1 ACP-gD. FRET and expression of the ACP and ST-proteins (ExpACP and ExpST) were measured. FRET ratio is shown as a function of the ExpACP/ExpST ratio. (B and C) TR-FRET saturation curves of CMV ST-gB with CMV ACP-gH/gL (B) or CMV ST-gH/gL with CMV ACP-gH/gL (C), as described in A. (D) SEC-MALS of soluble gH/gL (blue) and gH/gL in complex with MSL-109 Fab (purple) shown by UV absorbance (280 nM; Left axis). Molecular weight calculated from peak elutions and mass graphed as a thick line on the corresponding peak (Right axis). The second peak at ∼32.5 mL measures 47 kDa, consistent with excess Fab. (E) FRET ratio between ST-gH/gL and ACP-gH/gL after addition of PBS (white bar) or soluble gH/gL (black bar). (F) FRET ratio between ST-gB and ACP gH/gL recorded after addition of PBS (white bar), soluble gB (gray bar), or soluble gH/gL (black bar). Data in E are means ± SEM of triplicates from three independent experiments. Data in (A–C, and F) are means ± SEM of triplicates from a representative experiment.

