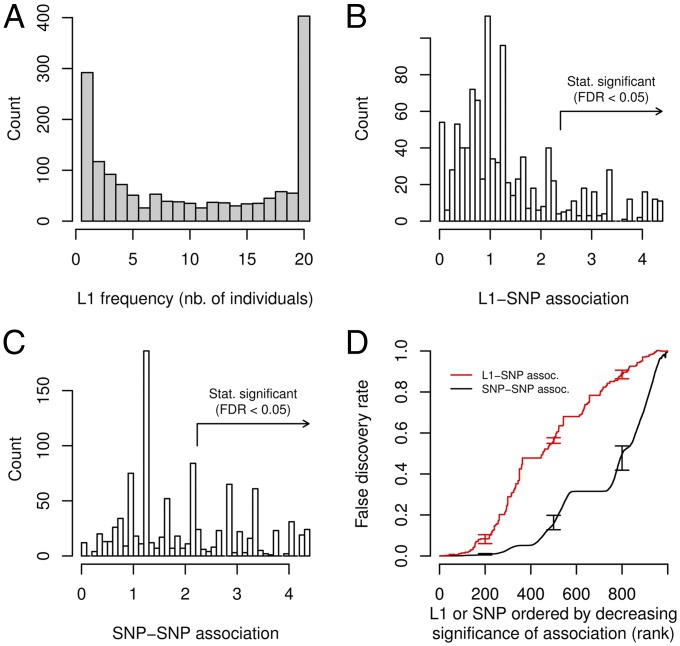
Fig. 1.
L1 frequency spectrum and association between L1 and surrounding SNPs in our Asian cohort. (A) Number of L1 elements detected that were present in a particular number of individuals (x-axis). (B) Distribution of L1-SNP association. Association was measured by the −log10(minimal P value) obtained from a series of Fisher’s exact tests between an L1 and SNPs in the 100 kb surrounding window. A total of 1,005 L1s were polymorphic across the 17 samples and had a least one testable (nonmonoallelic) surrounding SNP (on average 18 testable SNPs per L1). The arrow indicates the association corresponding to FDR ≤ 0.05 (estimated from 100 permutations). (C) Example distribution of SNP–SNP association. We selected an identically sized set of random, frequency-matched SNP and calculated association with neighboring SNPs and FDR in the same way as for L1s. The fraction of SNPs with FDR ≤ 0.05 is much larger than for L1s. (D) Significance of L1–SNP versus SNP–SNP association. L1s were ranked by decreasing association to surrounding SNPs and false discovery rate (FDR) was estimated by a permutation approach (red). The average FDR for the association of identically sized, frequency-matched sets of random SNPs with their surrounding SNPs is shown for comparison (black). Error bars indicate 10th and 90th percentile (100 permutations for L1-SNP, 10 permutation of each of 100 sets of random SNPs for SNP–SNP association).

