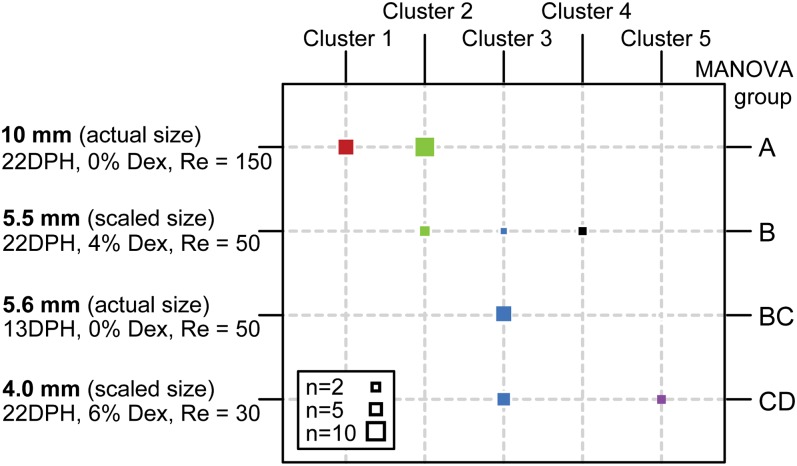
Fig. 6.
Discriminant analysis of strike kinematics recorded for dynamically scaled and nonscaled 13 and 22 DPH larvae. Strikes clustered according to dynamically scaled size (and Re), rather than to age. Columns and similar colors represent clusters determined by the discriminant function, whereas the rows correspond to groups predefined by age and dextran (Dex) concentration (left axis). Square size represents group size. The results of MANOVA pairwise comparisons performed on a PCA of strike kinematics are summarized along the right axis.

