
Fig. 2.
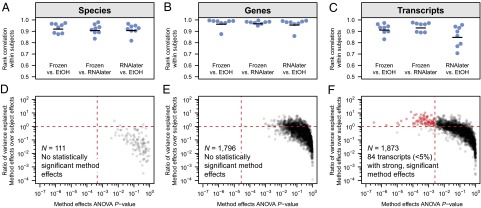
Taxonomic and functional profiles are consistent across sample handling methods. Global profiles of (A) species composition, (B) gene-level functional composition, and (C) transcript-level functional composition were highly concordant in within-subject comparisons of frozen controls vs. mock-shipped samples (Spearman’s rank correlation coefficient); black bars represent the averages across each group of eight correlation coefficients. Sample handling effect was further quantified by two-way ANOVA for all (D) species, (E) genes, and (F) transcripts detected with relative abundance of at least 10−4 (0.01%) in at least three samples. Following correction for multiple hypothesis testing, <5% of transcripts showed a strong, significant effect from choice of sample handling method; we observed no significant sample handling effects for either species or genes. Vertical red lines represent the threshold for statistical significance (Benjamini–Hochberg FDR, α = 0.05); features above the horizontal red lines have greater between-method variation than between-subject variation.