
Fig. 3.
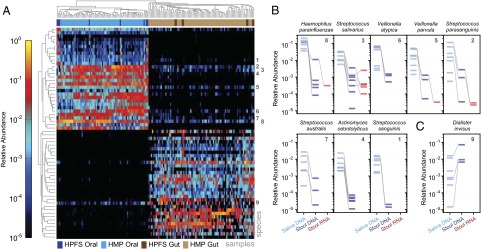
Oral-gut ecology in the HPFS and HMP cohorts. (A) We isolated species observed in the eight pairs of frozen stool and saliva samples from the HPFS cohort with relative abundance of at least 10−2 (1%) in two HPFS samples. The taxonomic profiles of these species were compared with stool and tongue samples from the HMP cohort, with tongue representing the oral community. Samples were clustered by Bray–Curtis distance, and species were clustered by rank correlation. Note that samples cluster strongly by body site (oral vs. gut). Highly abundant oral species are more likely to be detected at low levels in the gut. Green numbers associate oral-gut co-occurring species with detailed abundance profiles in B and C. (B) Eight abundant oral species detected in the HPFS saliva samples were detectable at low abundance in the stool samples from the same individuals, but showed minimal transcriptional activity in the stool. Gray lines connect oral DNA (light blue), gut DNA (dark blue), and gut RNA (red) from the same individual. (C) D. invisus is an unusual example of a gut-dominant species that also occurs in the oral cavity.