Fig. 4.
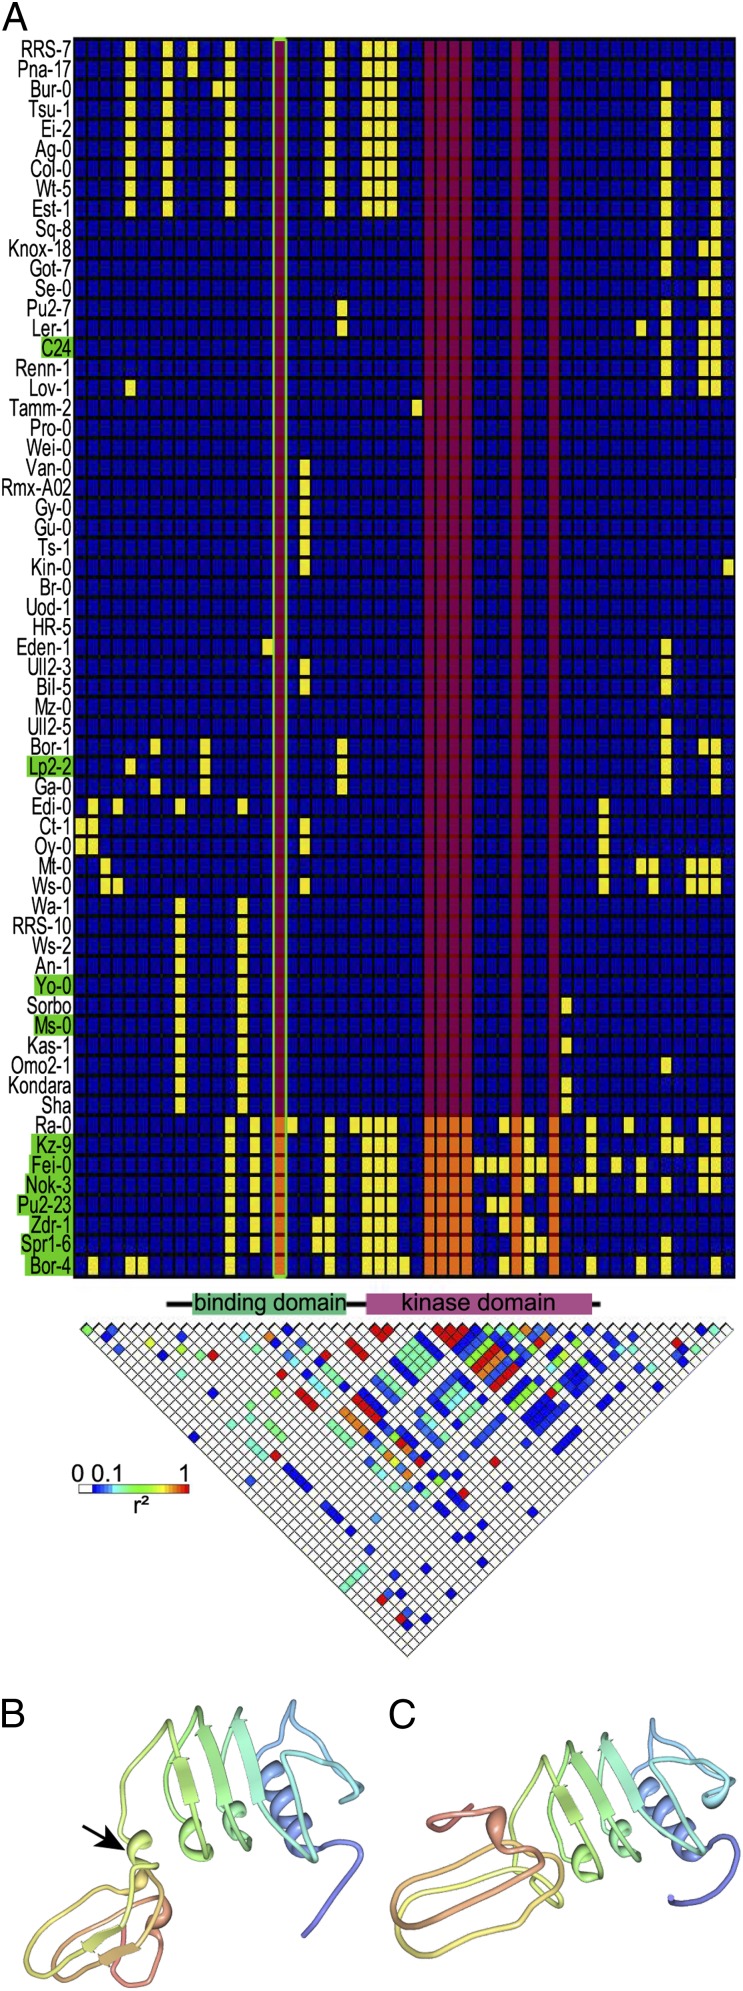
Polymorphisms in RPK1. (A) Haplotype structure map and linkage disequilibrium (LD) plot for RPK1 and the surrounding region in 62 fully sequenced accessions. In the haplotype structure map, each column represents a polymorphic site with minor and major alleles (yellow and blue, respectively) and clustering of accessions by haplotype. Highly regenerative accessions (regeneration rate at 21 d > 85%) are indicated in green. Regeneration-associated polymorphisms (P = 8.83E-05) are marked by a red overlay; the only associated polymorphism resulting in an amino acid change is framed in green. The LD plot reflects r2 for each pair of polymorphisms, with the strongest LD in red. The protein model between the plots gives the coding sequence (black line) and specific structural domains (34). Positions are not in proportion, because only polymorphic positions are included in the matrix. (B and C) 3D model of the extracellular binding domain of the (B) negative and (C) positive RPK1 variants predicted by PHYRE2 (35). Of the residues, (B) 95% and (C) 94% were modeled at a >90% confidence. The arrow marks an additional helix, resulting in a different conformation.

