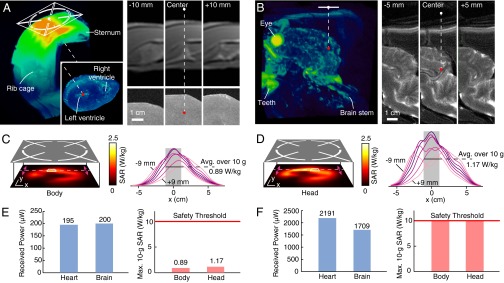
Fig. 3.

Received power and safety studies. (A) Configuration for power transfer across a porcine chest wall to the electrostimulation device on the heart surface reconstructed by MRI. The source center (white dot) and the coil (red dot) are 5 cm apart (1-cm air gap, 4-cm heterogeneous tissue). (B) Similar reconstruction when the device is inserted in the lower cortex region of a porcine brain. The source–receiver separation is 5.5 cm. (C and D) SAR distribution in a head/body-simulating liquid measured 1.2 cm from the metal plate when coupling 500 mW into tissue (Left). Distribution slices taken around the hotspot (Right; 1.5 mm spacing); the cubic averaging volume (10 g of tissue; ∼2.15 cm side length) is shaded. (E) Measurements of the power transferred to a device with a 2-mm diameter coil from the midfield source when coupling 500 mW into tissue for the configurations in A and B. Measurements of the maximum 10-g SAR and the exposure threshold. (F) Received power when the power coupled into tissue meets the maximum permitted level of exposure.
