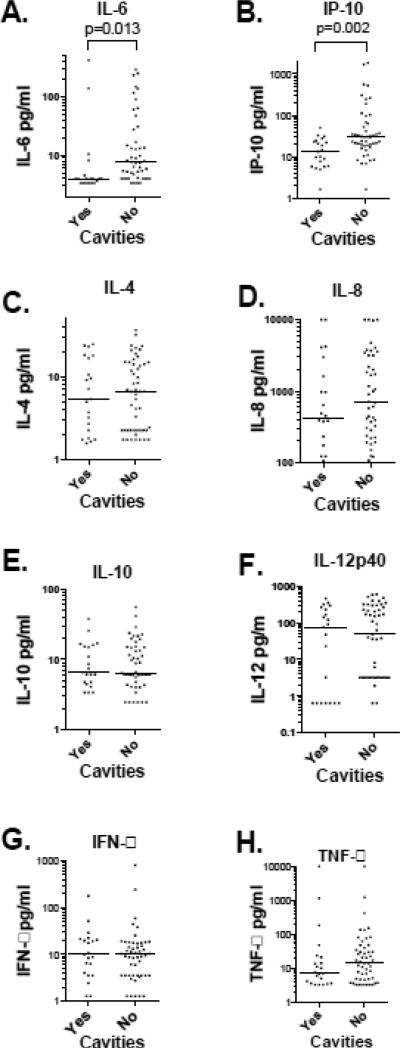
Figure 1. BAL cells cytokine elaboration in patients with an without cavities.
Cavity status is shown on the X axis. Each cytokine measured in this investigation is shown by log transformed concentration on the Y axis. The median value is represented by the horizontal line. Only IL-6 and IP-10 showed significant differences with Mann–Whitney U test between patients with and without cavities, p value shown above the bracket.

