
Fig. 5.
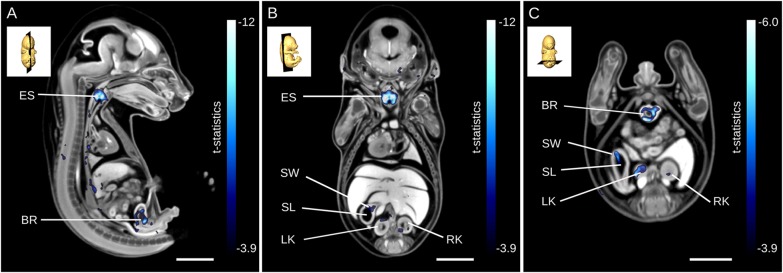
Deformation-based analysis identifying several anatomical phenotypes in the Tcf21-hypo mutant. (A-C) Results from deformation-based analysis presented for a mid-sagittal section through the esophagus (A), a coronal section through the kidneys (B) and an alternative transverse section through the kidneys (C). The blue color bar has a minimum that corresponds to an FDR threshold of 5% in. BR, bladder; ES, esophagus; LK, left kidney; RK, right kidney; SL, lumen; SW, stomach wall. Scale bars: 2 mm.