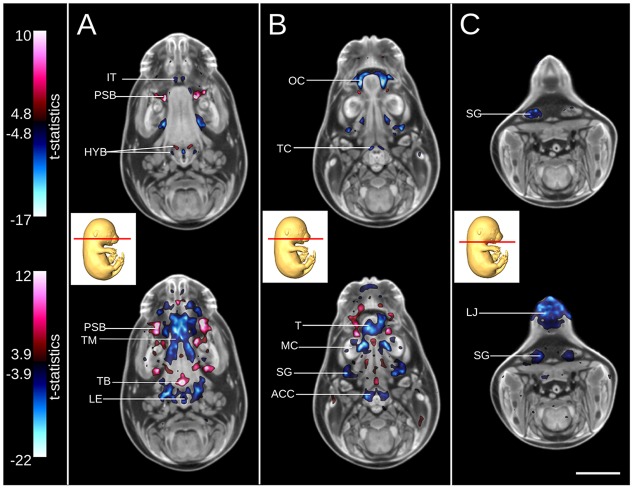
Fig. 7.
Subtle phenotypes of the Satb2 knockout demonstrated by intensity- and deformation-based analyses. (A-C) Transverse sections through the tongue (A), mandible (B) and lower jaw (C). Intensity-based analysis illustrating image intensity differences between the Satb2 wild type and knockout (top) and deformation-based analysis identifying local volume differences for the same sections (bottom). For intensity-based analysis (top), red and blue correspond to areas of brighter or darker image intensity in the knockout, respectively. For deformation-based analysis (bottom), red and blue correspond to areas of larger and smaller local volumes in the knockout, respectively. The minimum value for each color bar corresponds with a FDR threshold of 5%. ACC, arytenoid and cricoid cartilages; HYB, cartilage primordium of greater and lesser horn of hyoid bone; IT, incisor teeth; LE, opening to larynx and epiglottis; LJ, lower jaw; MC, Meckel's cartilage; OC, oral cavity; PSB, palatal shelf bulges; SG, submandibular gland; T, tongue; TB, base of tongue; TC, thyroid cartilage; TM, intrinsic muscle of tongue. Scale bar: 2 mm.

