
Table 4.
Cohen D effect size was calculated for all sleep parameters.
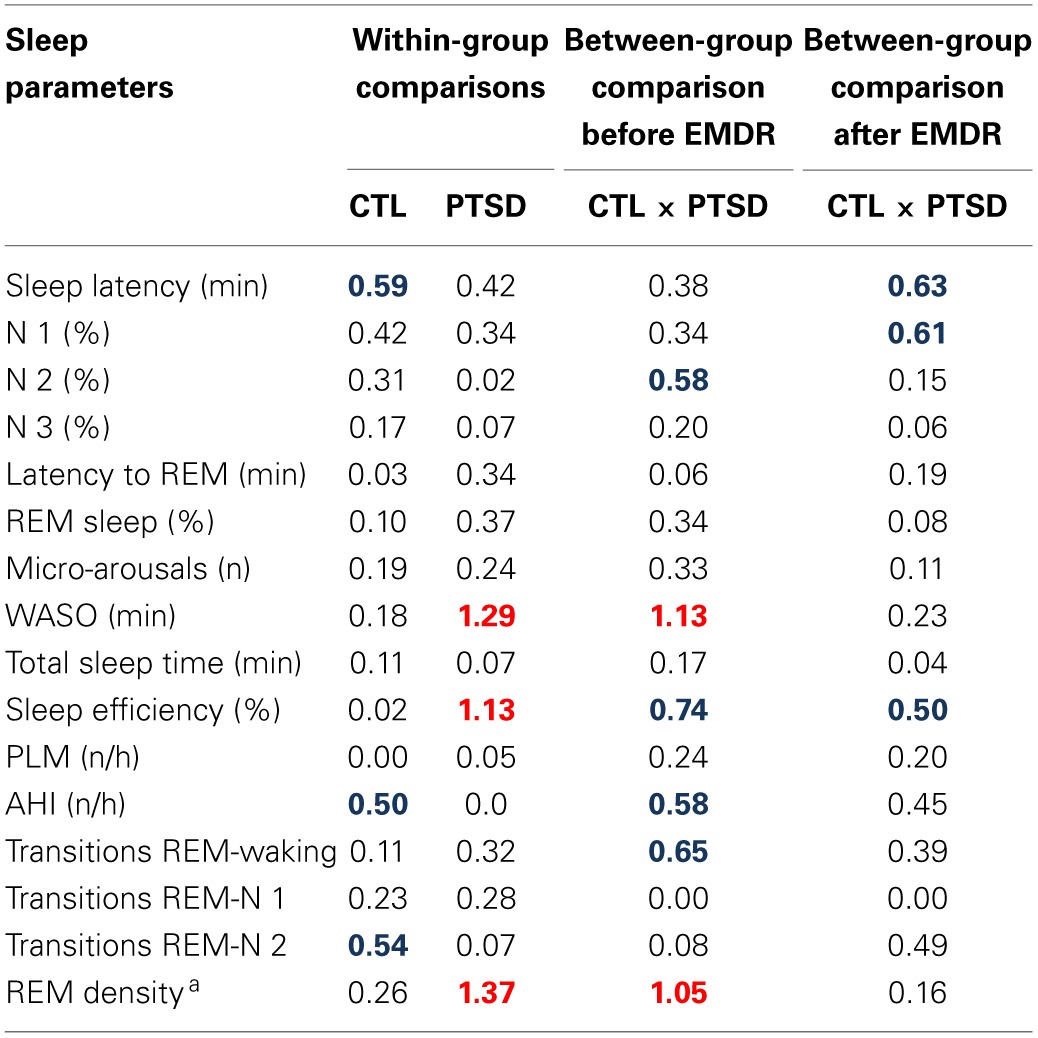
Comparisons were made within each group (before x after EMDR) and between groups in each time-point. Bold blue values represent moderate clinical relevance (values between 0.5 and 0.8), whereas those in red represent great clinical relevance (above 0.8).
a REM density was determined in 9 control subjects and 13 PTSD patients. WASO, waking after sleep onset, PLM, periodic limb movements; AHI: apnea-hypopnea index.