An official website of the United States government
Here's how you know
Official websites use .gov
A
.gov website belongs to an official
government organization in the United States.
Secure .gov websites use HTTPS
A lock (
) or https:// means you've safely
connected to the .gov website. Share sensitive
information only on official, secure websites.

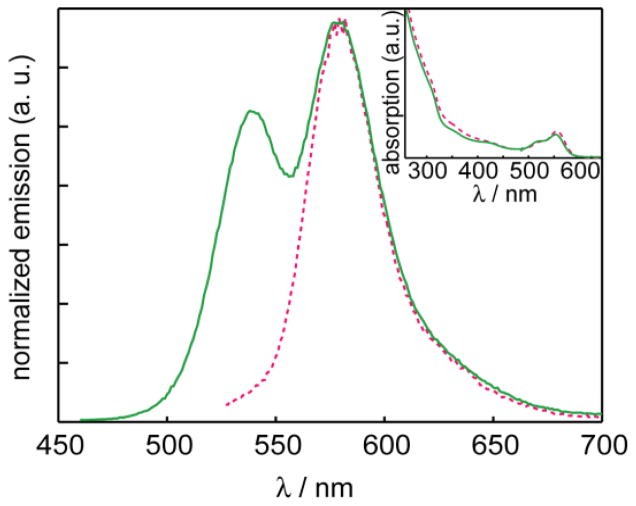
 ) vs. the Förster pair of the conjugated NC-RITC (red dashed line
 ), normalized by the maximum intensity of the dye emission. (Inset) The concentrations are matched by absorbance.