
Fig. 3.
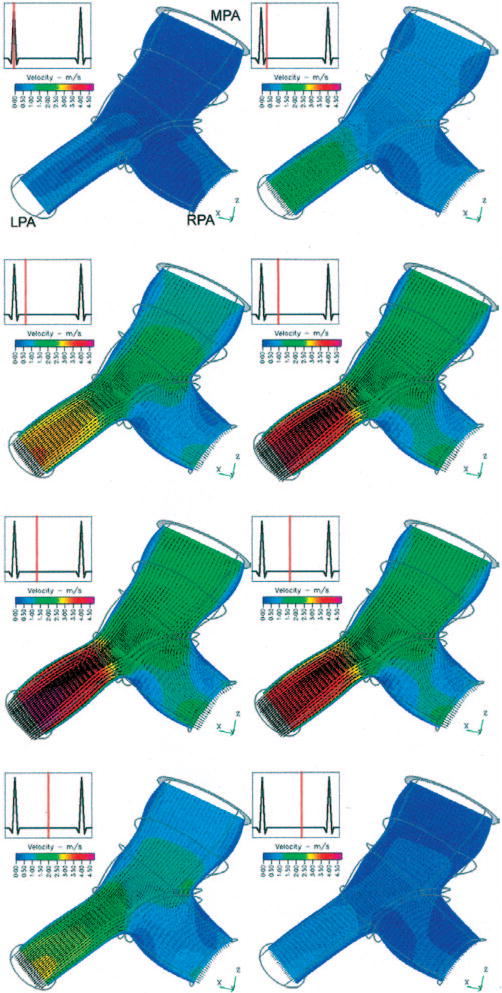
Oblique superior view of velocity vectors and velocity magnitude contours within a transverse mid-vessel slice of the MPA and proximal PA branches of model 1 at eight time points within the cardiac cycle. The thick gray circle at the top of the figure is the MPA inlet slice; thin gray lines outline the artery shape distal to the inlet. The change in domain shape is due to arterial wall motion, and the velocity contour color mapping is consistent through the series.