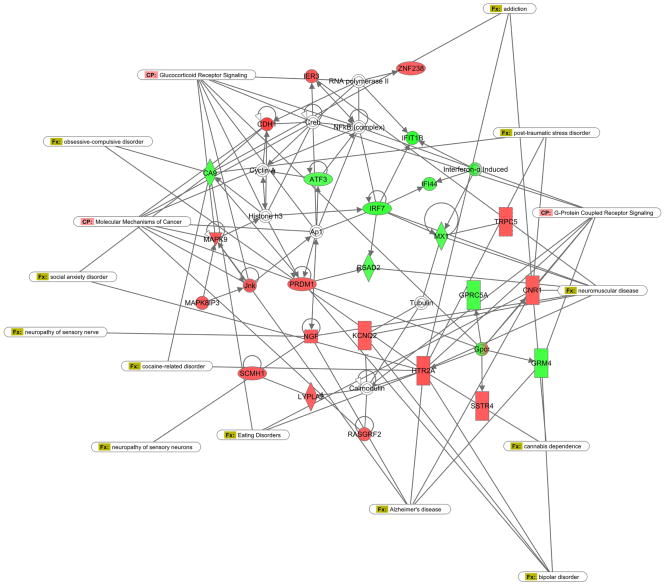
Figure 3.
Ingenuity Pathway Analyses: Pathway analyses were from the commercially available Ingenuity Pathway Analysis software. Input was the top 100 up- and top 100-downregulated probes ordered by fold change. Three networks were significantly enriched. Up-regulated probes are in red whereas down-regulated probes are in green. The network 2 shown here was defined as “Neurological disease, organ injury, inflammatory disease”. Canonical pathways identified by the pattern of gene expression are shown in the long ovals labeled “CP” in pink. These included a large number of G-protein coupled receptors. Associated disease states are also in long ovals labeled “Fx” in green. A number of disorders related to anxiety, addiction and stress were significantly over-represented (social anxiety; “ptsd”).

