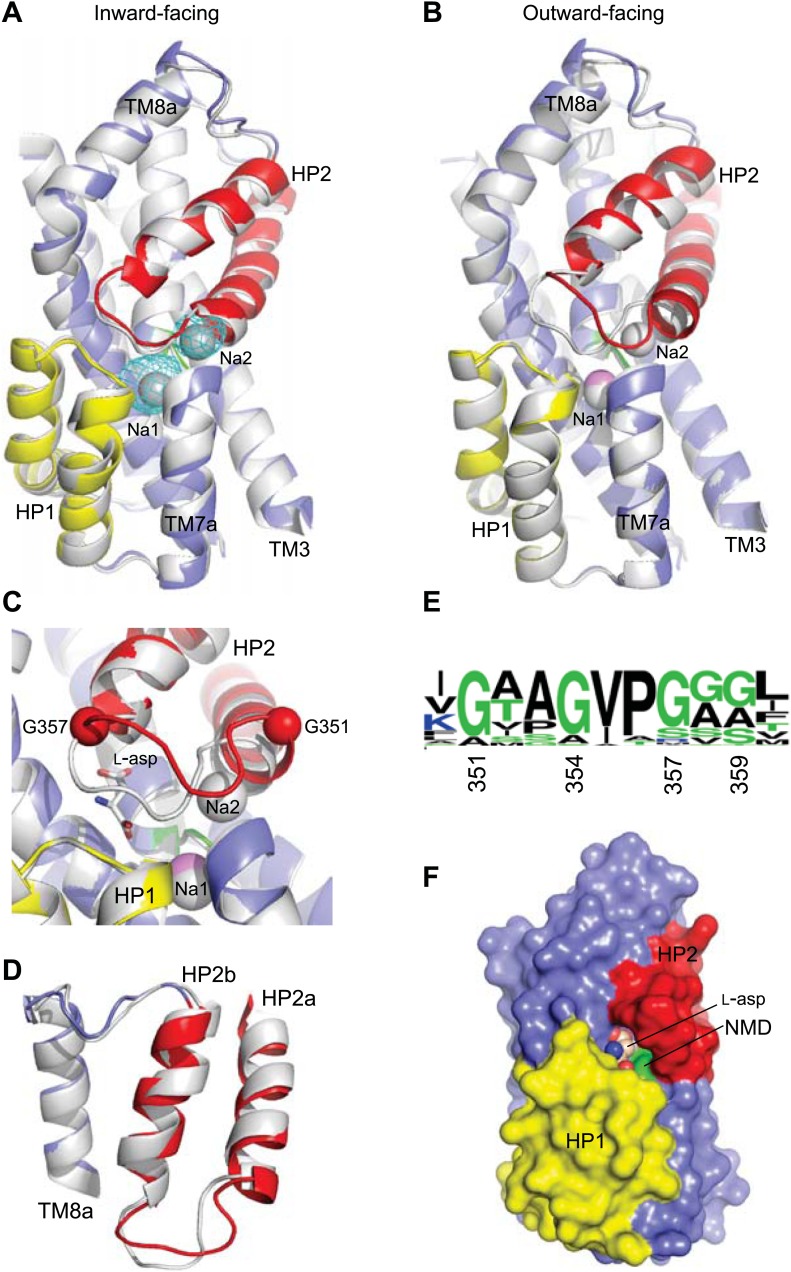
Figure 6. Structures of ions-only bound transport domain.
(A) Superimposition of the fully bound transport domains (grey) and Tl+-bound GltPhin transport domain in the bound-like conformation (colors), with the averaged anomalous difference Fourier map contoured at 8σ (cyan mesh). (B) Superimposition of the fully bound (grey) and Na+-only bound GltPh-R397A (colors) transport domains. (C) Na+ and L-asp binding sites with fully-bound structure shown in white and Na+-bound structure in colors. Hinge glycine residues are shown as spheres. The modeled Na+ ion in Na1 site is pink. (D) Superimposition of the HP2-TM8 in the fully bound transport domain (grey) and in GltPh-R397A bound to Na+ only (colors), showing similar conformations of HP2a. (E) WebLogo representation of the consensus sequence and relative abundance of residues in HP2 tip. (F) Surface representation of the transport domain of GltPh-R397A bound to Na+ only showing access to the substrate-binding site. L-asp was placed into the binding site for reference.
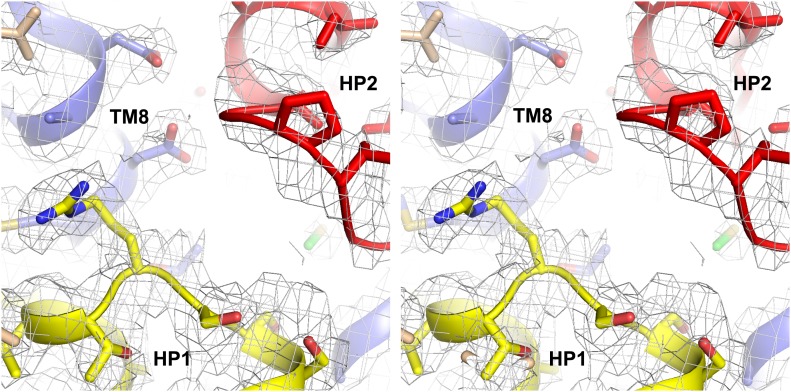
Figure 6—figure supplement 1. Na+ only bound GltPh-R397A.
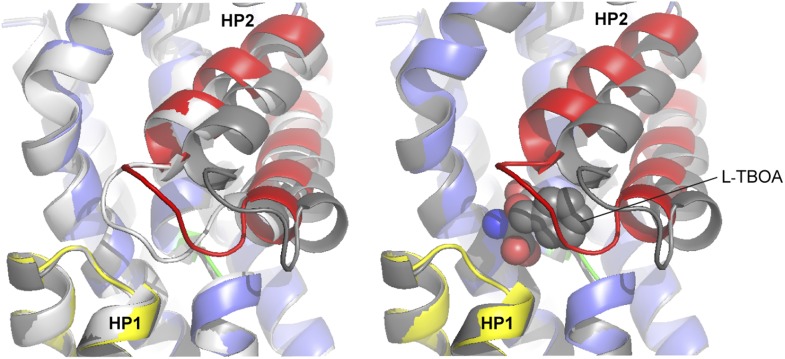
Figure 6—figure supplement 2. Superimposition of the transport domains bound to Na+ and L-asp (light grey), Na+ and L-TBOA (dark grey) and Na+ only (colors).
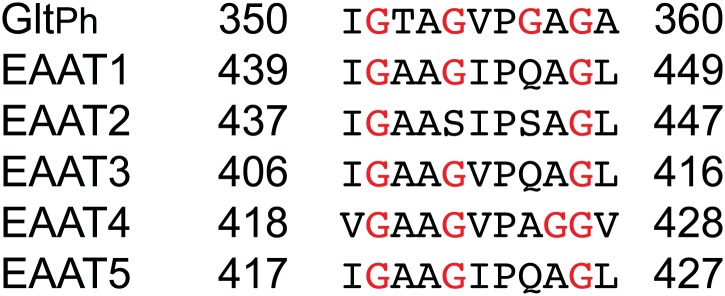
Figure 6—figure supplement 3. Sequence alignment for the HP2 tip region of GltPh and human EAAT sub-types 1–5.


