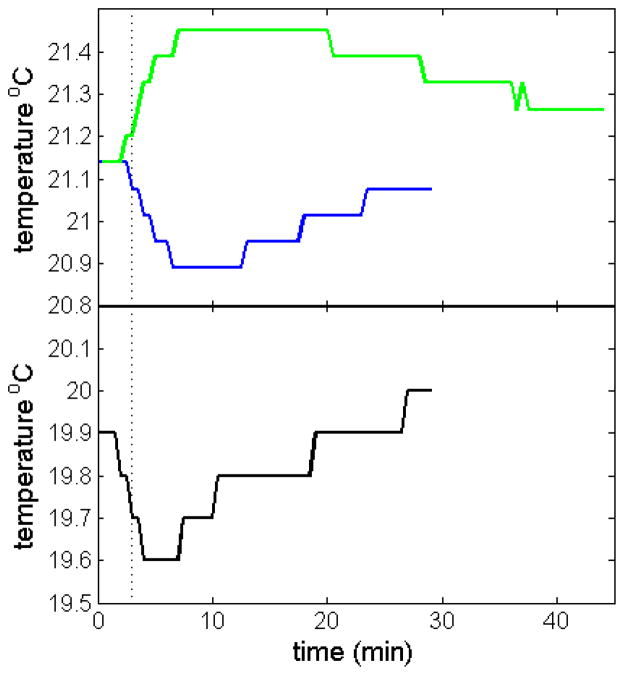
Figure 3.
Rotor temperature measurement after start of acceleration to 50,000 rpm (Top, blue), and after deceleration of the rotor (Top, green) in instrument Shemp. For comparison, the console temperature reading after start of acceleration is shown in the lower plot (Bottom, black). Data were acquired with the iButton in the rotor handle of an An-50 Ti rotor, with both acceleration and deceleration at maximum setting. For the acceleration phase, the time when full speed of 50,000 rpm is reached is indicated as dotted vertical line.

