
Figure 5.
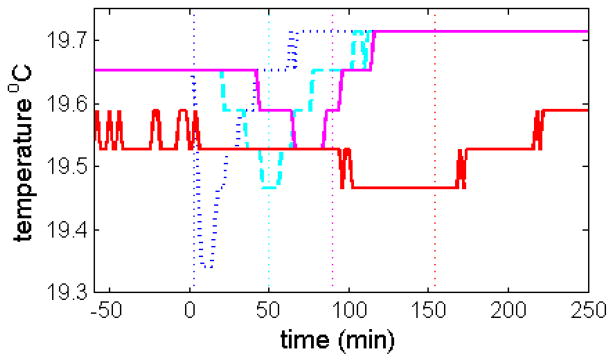
Measured time-course of temperature during rotor acceleration to 50,000 rpm in the same instrument (Momo) with either standard maximum acceleration of 280 rpm/sec (blue dottted line), with a slow acceleration of 16.7 rpm/sec manually approximated by a step-wise change of rotor speed at a rate of 1,000 rpm per minute (cyan dashed line), with an acceleration of 11.1 rpm/sec approximated in steps of 1,000 rpm per 90 sec (magenta solid line), and with an acceleration of 5.6 rpm/sec approximated in steps of 1,000 rpm per 180 sec (red solid line). The vertical dotted lines indicate the time-points when 50,000 rpm was reached in the respective experiments.