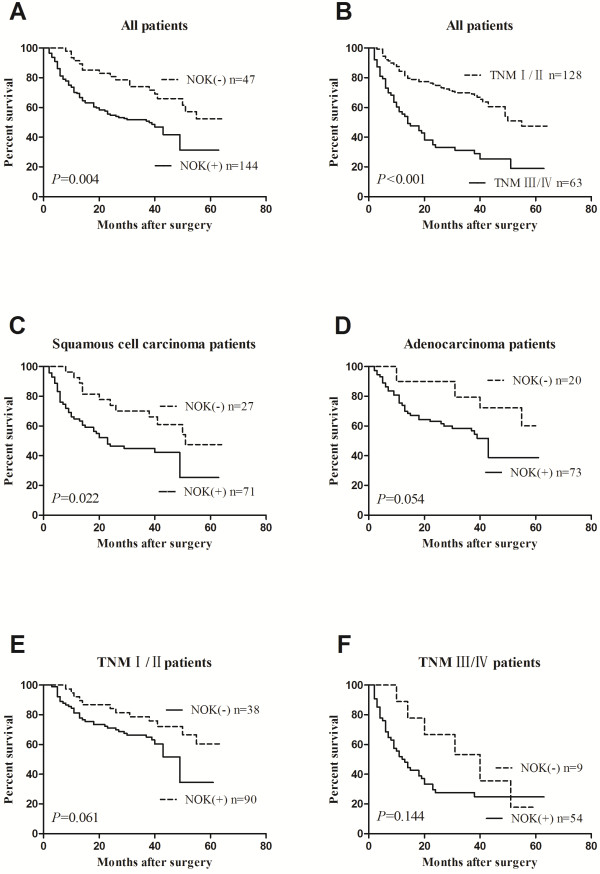
Figure 2.

Kaplan-Meier survival analysis for NSCLC patients. The P-value was determined using the log-rank test. (A) Comparison of the overall survival (OS) between NOK negative and NOK positive NSCLC patients. (B) Comparison of the OS between pTNM I/II and pTNM III/IV patients. (C) Comparison of the OS between NOK negative and NOK positive SCC patients. (D) Comparison of the OS between NOK negative and NOK positive ADC patients. (E) Comparison of the OS between NOK negative and NOK positive pTNM I/II patients. (F) Comparison of the OS between NOK negative and NOK positive pTNM III/IV patients.
