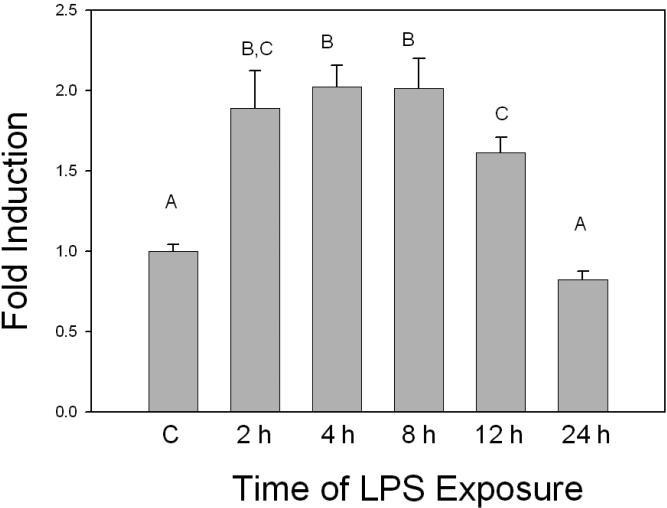
FIGURE 1.
Induction of MRP-1 mRNA by LPS. Total RNA was isolated from RAW 264.7 cells exposed to LPS for periods ranging between 2 h and 24 h. Levels of MRP-1 RNA were determined by real time PCR. Relative quantification of gene expression was performed with GAPDH as the endogenous control using the 2-ΔΔCt method. All assays were run in triplicate. The data shown are the results from 3 independent experiments. Letters different from each other indicate a statistical difference between treatment groups (p<0.05) as determined by a one way ANOVA followed by Duncan's Multiple Range Test.

