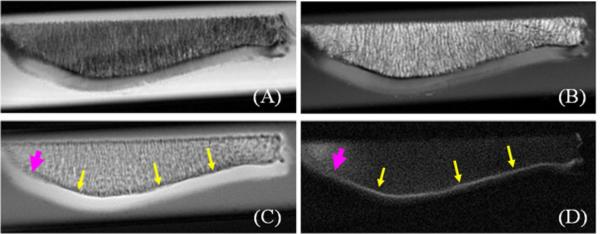
Figure 4.

Imaging of a patella slab using PD-FSE (A), T1-FSE (B), regular UTE (C) and DIR-UTE (D) sequences, respectively. The clinical FSE sequences show a signal void for the ZCC (A, B). The regular UTE sequence shows high signal for the ZCC, but provides little contrast between the ZCC (arrows) and the superficial layers of cartilage (C). The DIR-UTE sequence selectively suppresses signals from fat and the superficial layers of cartilage, creating high contrast for the ZCC which is shows as a linear, well-defined area of high signal (thin arrows) ) (D). There is a reduction in signal and increase in thickness from the ZCC in the lateral part of the patella (thick arrows) where morphological degradation was observed.
