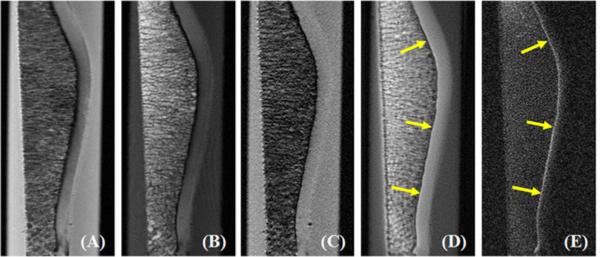
Figure 5.

Imaging of a normal patella sample using PD-FSE (A), T1-FSE (B), GRE (C), regular UTE (D) and DIR-UTE (E) sequences. The clinical FSE and GRE sequences show a signal void for the ZCC. The regular UTE sequence shows high signal but low contrast for the ZCC (arrows). This is shown with high contrast by the DIR-UTE sequence (E).
