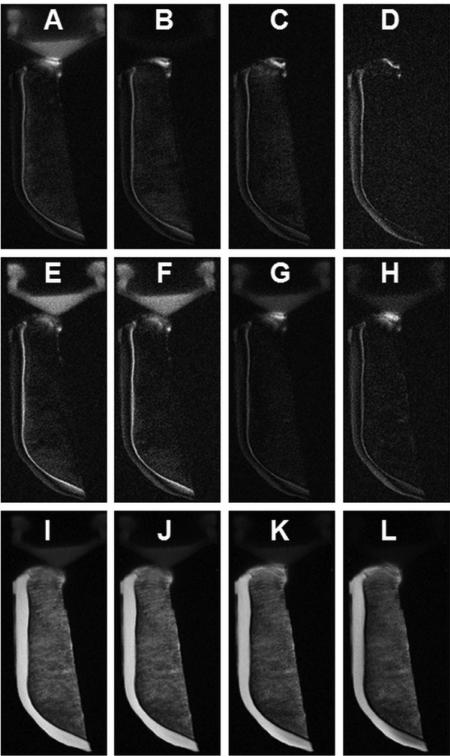
Figure 7.
DIR-UTE imaging of the ZCC at a series of TEs of 8 μs (A), 1 ms (B), 4 ms (C) and 12 ms (D), as well as DIR-UTE T1ρ imaging of the ZCC at a series of TSLs of 0.02 ms (E), 1 ms (F), 4 ms (G) and 12 ms (H). Fat saturated UTE imaging of the same patella at a series of TEs of 8 μs (I), 1 ms (J), 4 ms (K) and 12 ms (L) are also displayed for comparison. There is progressive loss of signal from (A) to (D) and from (E) to (H). Fat saturation alone provides poor delineation of the ZCC (I-L).

