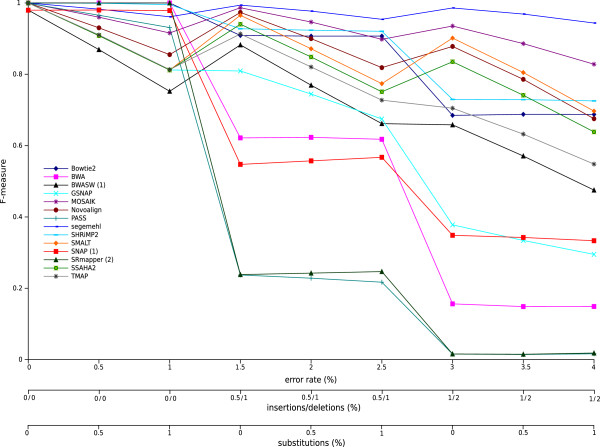
Figure 3.
F-measures with varying error rate for each mapper dealing with simulated datasets. F-measures are shown for error rates from 0 to 4%. The simulated read datasets consisted of 50,000 reads with a mean length of 200 bases. (1) indicates the mappers that report only one read (‘any-best’ mode) and (2) indicates the mappers that can run only in ‘all-best’ mode.

