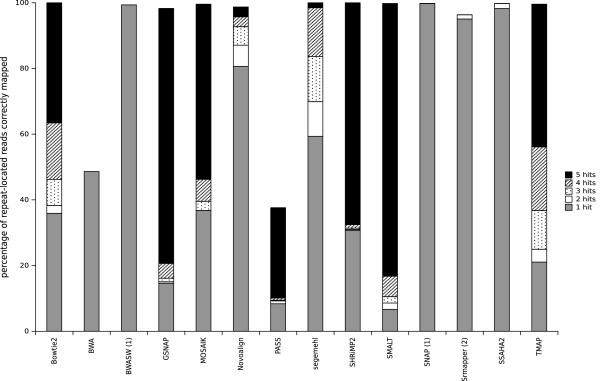
Figure 5.

Percentage of repeat-located reads correctly reported by the mappers. The percentage of reads correctly reported in a repeat is shown for the mappers dealing with simulated reads of 200 bases, subdivided in classes depending on the number of identified hits. (1) indicates mappers that that report only one read (‘any-best’ mode) and (2) indicates the mappers that can run only in ‘all-best’ mode.
