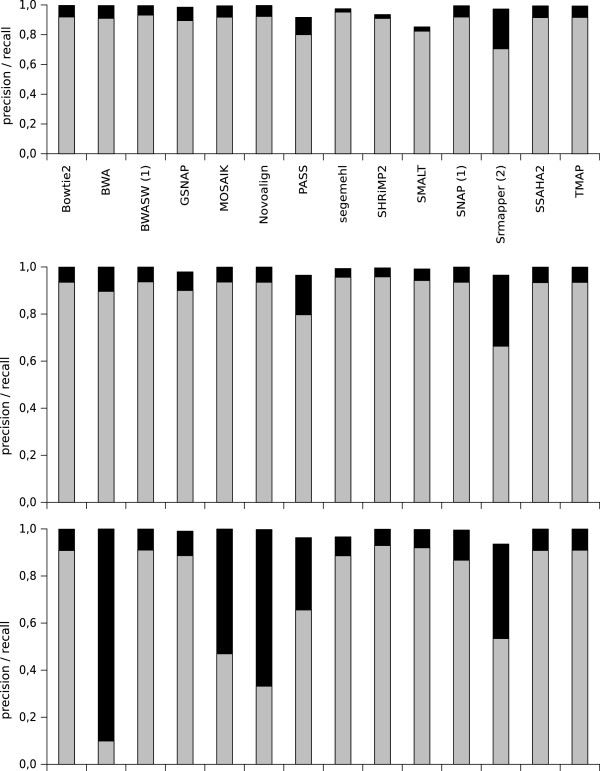
Figure 6.
Precision and recall values for mutation discovery with varying mutation rates in the reference genome. The real datasets that were used contained reads of 200 bases and had a theoretical depth of 40X. The precision (in black) and recall (in gray) values obtained for mutation discovery for each mapper are shown. Top panel: 0.05% mutations in the reference genome; middle panel: 1% mutations in the reference genome; and bottom panel: 5% mutations in the reference genome. (1) indicates the mappers that report only one read (‘any-best’ mode) and (2) indicates the mappers that can run only in ‘all-best’ mode.

