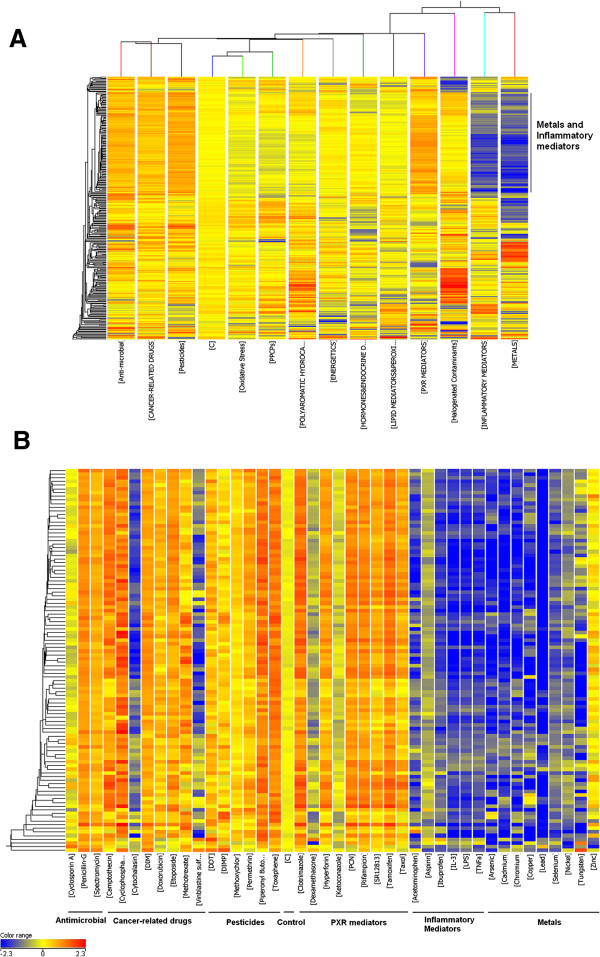
Figure 7.
Gene expression pattern analysis of biomarkers. A. 300 transcripts (horizontal axis) resulted from the Gradient algorithm was used to perform a two-way hierarchical analysis across 14 classes (vertical axis). B. 104 transcripts (horizontal axis) were used to perform a hierarchical clustering across different compounds in the classes of antimicrobial, cancer related drugs, pesticides, PXR mediators, inflammatory mediators, and metals as well as control (vertical axis). An Euclidean distance algorithm was applied to calculate the distances between transcripts or between conditions. The relative level of gene expression is indicated by the color scale at the bottom of Figure 7B.

