Figure 6.
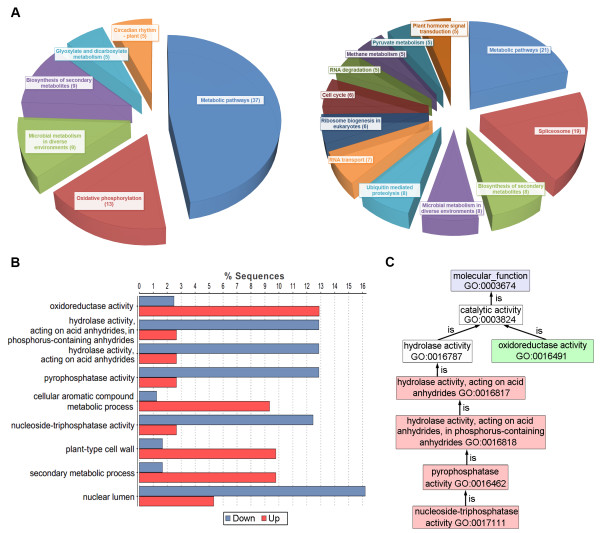
Comparison of annotations between up- and down-regulated unigenes in sterile buds. A: a pie chart of KEGG annotation in up-(left) and down-(right) regulated unigenes (n > 4), respectively; B: a statistical column diagram of GO annotation; C: an enriched graph of molecular function in GO annotation. They were filtered using default value.

