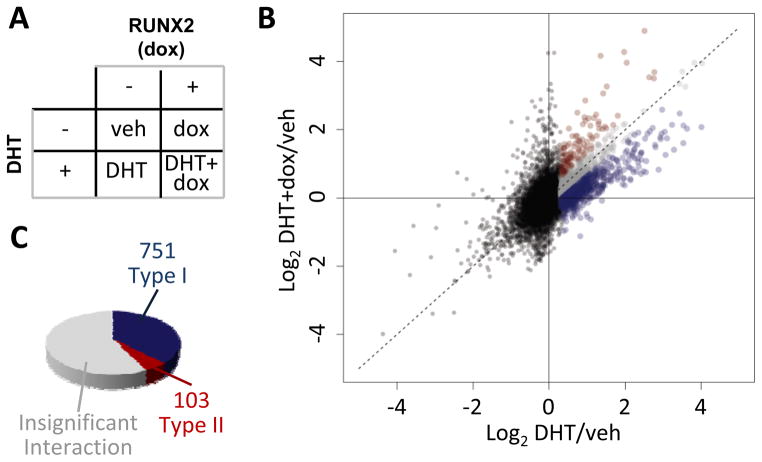
Figure 1. RUNX2 modulates AR activity in a locus-specific manner.
A. C4-2B/Rx2dox cells were treated as indicated with dox and/or DHT, and mRNA expression was profiled using Illumina’s Bead-chip arrays. B. Scatter plot describing the response to DHT+dox versus the response to DHT alone. Black dots represent genes not significantly up-regulated by DHT and grey dots represent genes with DHT response not significantly influenced by RUNX2. Blue and red dots represent Type I and type II genes, defined, respectively, based on attenuated or augmented response to DHT+dox versus DHT alone. C. Pie chart illustrating the frequency of genes whose stimulation by DHT is attenuated (blue), augmented (red), or not significantly changed (grey) in the presence versus absence of RUNX2. Data represent a combined analysis of three biological replicates.

