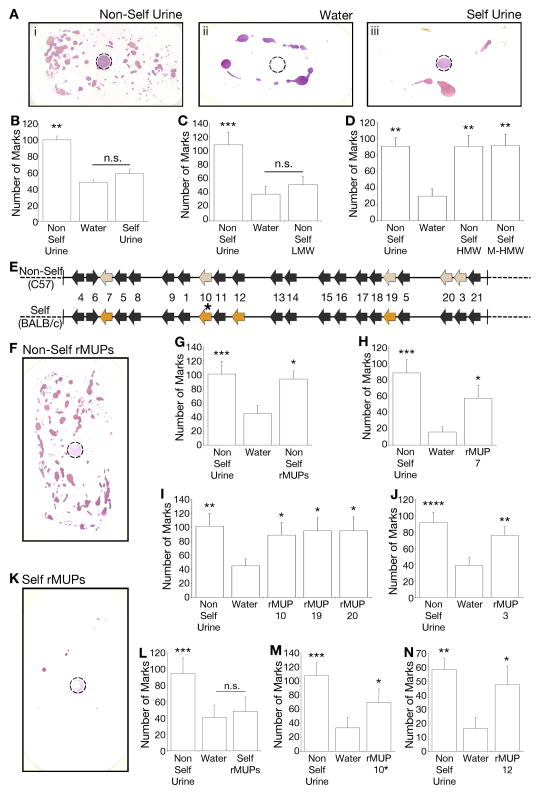
Figure 1. MUPs are sufficient to elicit marking behavior.
(A) Representative blots of urine marks deposited by BALB/c males in response to olfactory stimuli (dotted circle): non-self (C57BL/6J) urine (i), water (ii), or self (BALB/cByJ) urine (iii). (B–D) Quantification of urine marks to total urine (B), low molecular weight (LMW) fraction of non-self urine (C), or high molecular weight fraction with (HMW) or without (M-HMW) bound small molecules (D). (E) Genomic representation of Mup gene cluster. Colored arrows indicate genes expressed by non-self (C57BL/6J – top panel) or self (BALB/cByJ - bottom) strains. * indicates the Q159K MUP10 allelic variant present in BALB/cByJ, all other MUPs have the same amino acid sequences between the two strains. (F–G) Behavioral response to a mixture of non-self recombinant MUPs (rMUP3+rMUP7+rMUP10+rMUP19+rMUP20). (H–J) Quantification of behavioral responses to individual non-self rMUPs. (K–L) Behavioral response to a mixture of self-emitted rMUPs (rMUP7+rMUP10*+rMUP12+rMUP19); and (M–N) to individual self-emitted rMUPs (also see panels H & I). n=8–16. Mean + standard error of the mean (SEM). p-values determined by a repeated measures one-way ANOVA, with a Greenhouse-Geisser correction, followed by Bonferroni multiple comparisons test or by Friedman’s non-parametric test followed by Dunn’s multiple comparison test. ****p<0.0001, ***p<0.001, **p<0.01, *p<0.05. n.s. = non-significant. p-values determined by comparison to water. See also Figure S1.

