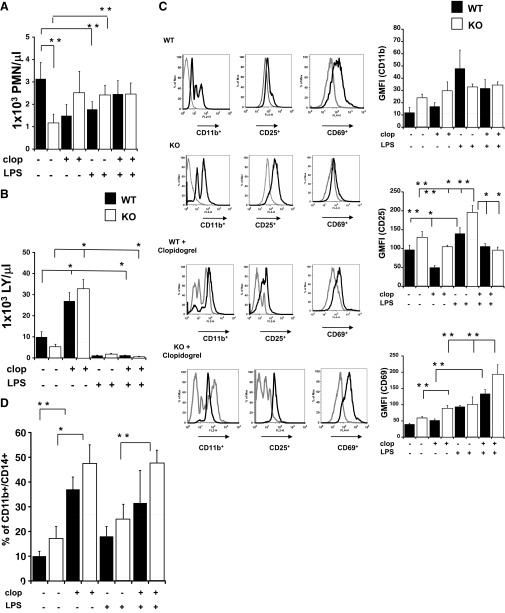
Figure 4. LPS treatments also alter cell content in the bone marrow of P2Y12 KO mice.
Cells isolated from the bone marrow were analyzed, and graphs show neutrophil (A) and lymphocyte (B) count in WT (black) and P2Y12 KO mice (white) for control, clopidogrel, LPS, and LPS plus clopidogrel. *P < 0.01 and **P < 0.05 treated versus untreated and WT versus KO (n=6). (C) Representative flow cytometry histograms (left) showing CD11b, CD25, and CD69 staining in WT, KO, WT plus clopidogrel, and KO plus clopidogrel of LPS-treated (black line) and untreated (gray line) bone marrow samples. GMFI values of WT (black bars) and KO (white bars) are plotted on the right. *P < 0.01 and **P < 0.05 treated versus untreated and WT versus KO (n=6). Isotype controls were 7.5 ± 0.3 for PE-labeled (CD11b), 84 ± 9 for APC-labeled (CD25), and 28 ± 6 for APC-labeled (CD69). (D) Percentage values of CD11b+CD14+ cells in WT (black bars) and KO (white bars) are plotted for controls, clopidogrel, LPS, and LPS plus clopidogrel animals analyzed in WT and KO (n=6). Negative control was 5 ± 1%.

