
Figure 5. Pulmonary injury is increased in LPS-treated P2Y12 null mice compared with treated WT mice.
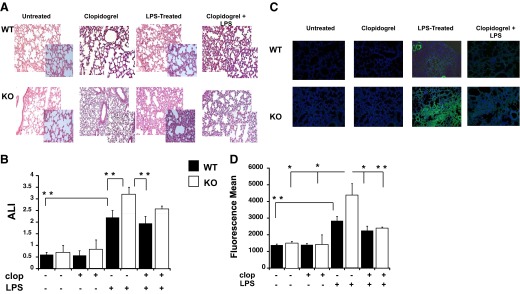
(A) Photomicrographs of H&E-stained tissue sections obtained 4 days after LPS treatment. Representative images of lung-tissue specimens were obtained from LPS, LPS plus clopidogrel, clopidogrel alone, or vehicle control-treated WT and KO mice (original magnification, 20× and 40×; n=6). (B) The ALI score, based on alveolar capillary congestion, hemorrhage, infiltration, or aggregation of neutrophils in the airspace or the vessel wall and thickness of the alveolar wall, was assessed in WT (black bars) and KO (white bars) untreated, clopidogrel, LPS, and clopidogrel plus LPS-treated mice. **P < 0.05 treated versus untreated and WT versus KO (n=6). (C) Representative images of MPO staining (MPO, green; nucleus, blue; original magnification, 20×) for LPS, LPS plus clopidogrel, clopidogrel alone, or vehicle control WT and KO mice. (D) Fluorescence mean of MPO staining values. *P < 0.01 and **P < 0.05 (n=3).