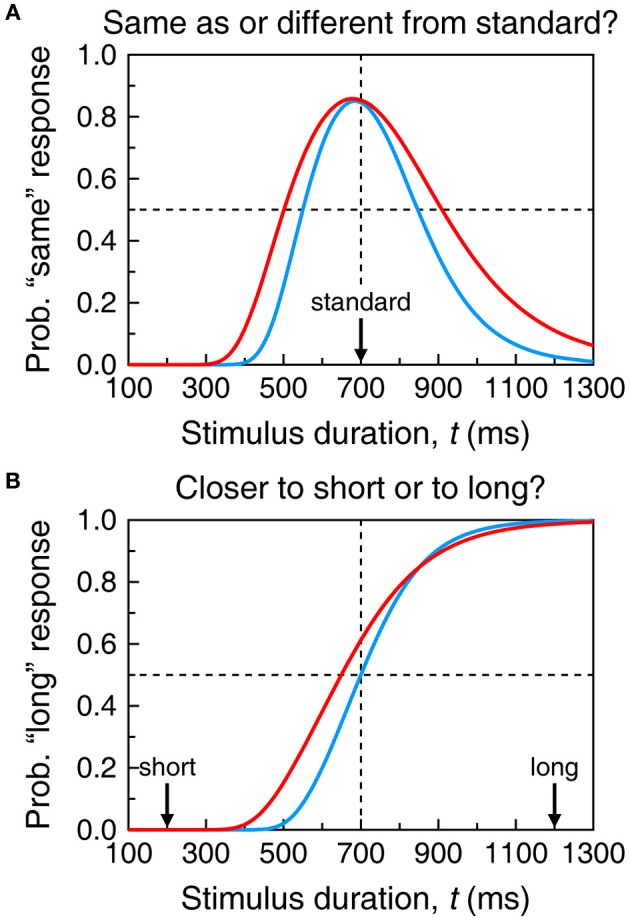
Figure 2.

Sample psychometric functions in the temporal generalization task (A) and the temporal bisection task (B). Each function in each panel results from the psychophysical function plotted with the same color in Figure 1, with additional assumptions coming from the models described in sections A Unified Model of Performance across Semi-Objective Psychophysical Tasks and Single-Presentation Methods. Specifically, in the top panel, δ = 150 whereas in the bottom panel, δ = 70 and ξ = 0.5. In both cases γ = 0.15. The red curve in (A) is the same psychometric function plotted in Figure 4A; the red curve in (B) is the same psychometric function plotted with continuous black trace in Figure 5A.
