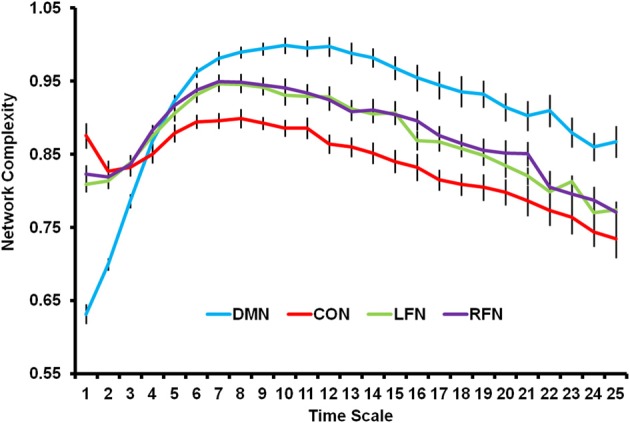
Figure 3.

Network complexity is plotted across time scales for the DMN, CON, LFN, and RFN. All networks showed a skewed inverted-U pattern of neural complexity across the time scales. Neural complexity at fine time scales was greatest for the CON, followed by the LFN and RFN, and was smallest for the DMN. However, neural complexity at mid and coarse time scales was greatest for the DMN, followed by the LFN and RFN, and was smallest for the CON. DMN, default mode network; CON, cingulo-opercular network; LFN, left frontoparietal network; RFN, right frontoparietal network. Error bars represent standard error of the mean.
