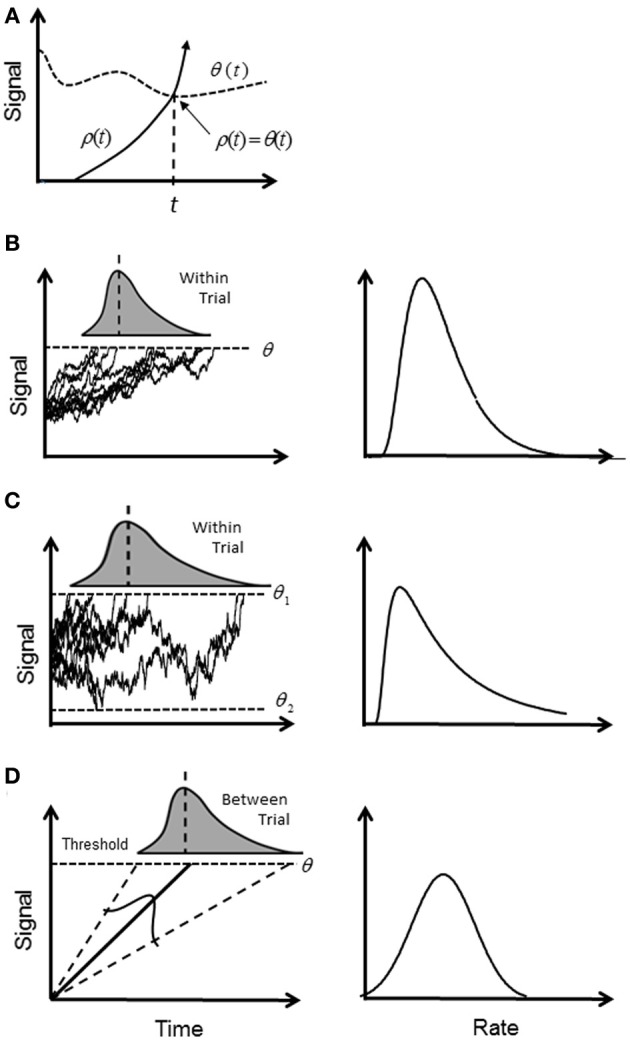
Figure 1.

Illustration of accumulator models: (A) general first-passage scheme where a triggered event occurs when a signal ρ (t) first crosses the trigger level θ (t). Note that crossing is a solution to the equation ρ (t) = θ (t); (B) in the diffusion model ρ (t) increases stochastically and triggers a response when it reaches a constant θ (t), or “threshold.” The signal is assumed to be a Wiener process, and the first passage time is a within-trial random variable (shaded curve) with an inverse Gaussian distribution. In the rate domain (right column) the rate distribution remains positively skewed; (C) the diffusion model for two boundaries, where boundary θ 1 (t) determines correct responses, and boundary θ 2 (t) determines error responses. In the rate domain, rate of correct responses remains positively skewed. (D) In the deterministic model, ρ (t) increases linearly and deterministically until the threshold is reached. It is assumed that the slope of rise is a between-trial Normal random variable and gives rise to a reciprocal Normal distribution. In the rate domain, rate is distributed with a truncated Normal distribution.
