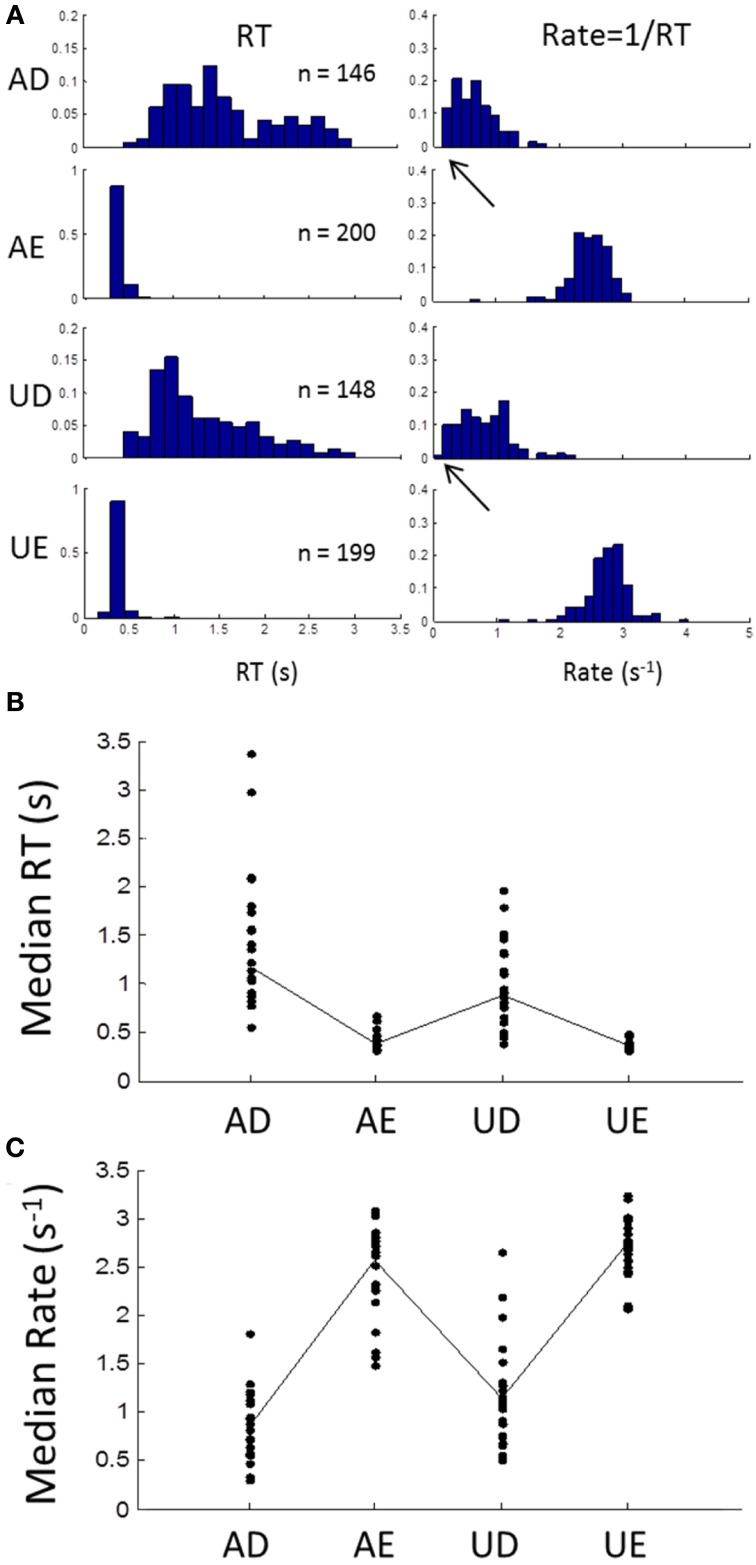
Figure 2.
(A) An example of an individual subject's frequency distributions of RT (left column) and rate (right column) for the 4 different blocks (AD, accurate and difficult; AE, accurate and easy; UD, urgent and difficult; UE, urgent and easy; see Methods). In the easy tasks, RTs are brief with few errors (block size was 200 trials). For the difficult tasks RTs are much more variable with about 25% error rate. In the rate-domain, dispersion is similar for all blocks with a shift to lower rates for the difficult tasks. Note that the shift approaches zero (arrows) suggesting possible truncation. (B) Median RTs for all subjects showing longer RTs for difficult blocks and more inter-subject variability. (C) Same as (B) but for median rates showing similar inter-subject variability for all blocks.

