
Figure 4.
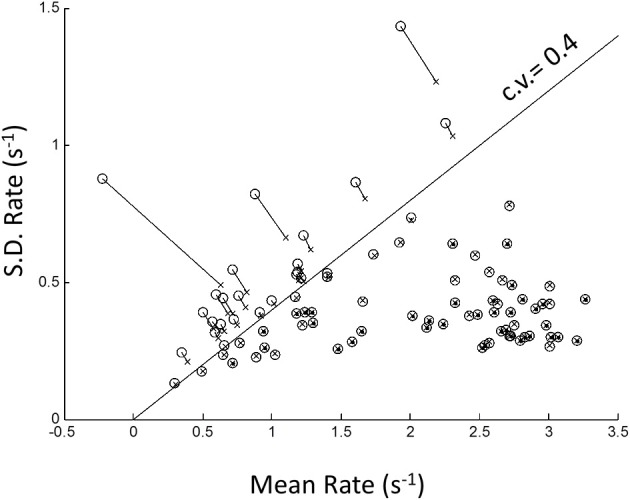
Plot of standard deviation vs. mean of all blocks in the rate-domain. Crosses indicate conventional sample moments (same as top-right panel in Figure 3). Circles indicate maximum likelihood estimates (MLE) of same blocks assuming a left truncated Normal. Line is SD = Mean/2.5. To the right of line sample moments coincide with rectrN MLE moments; to the left MLE moments shift to higher standard deviations and lower means (connecting lines).